
Dashboard and departments
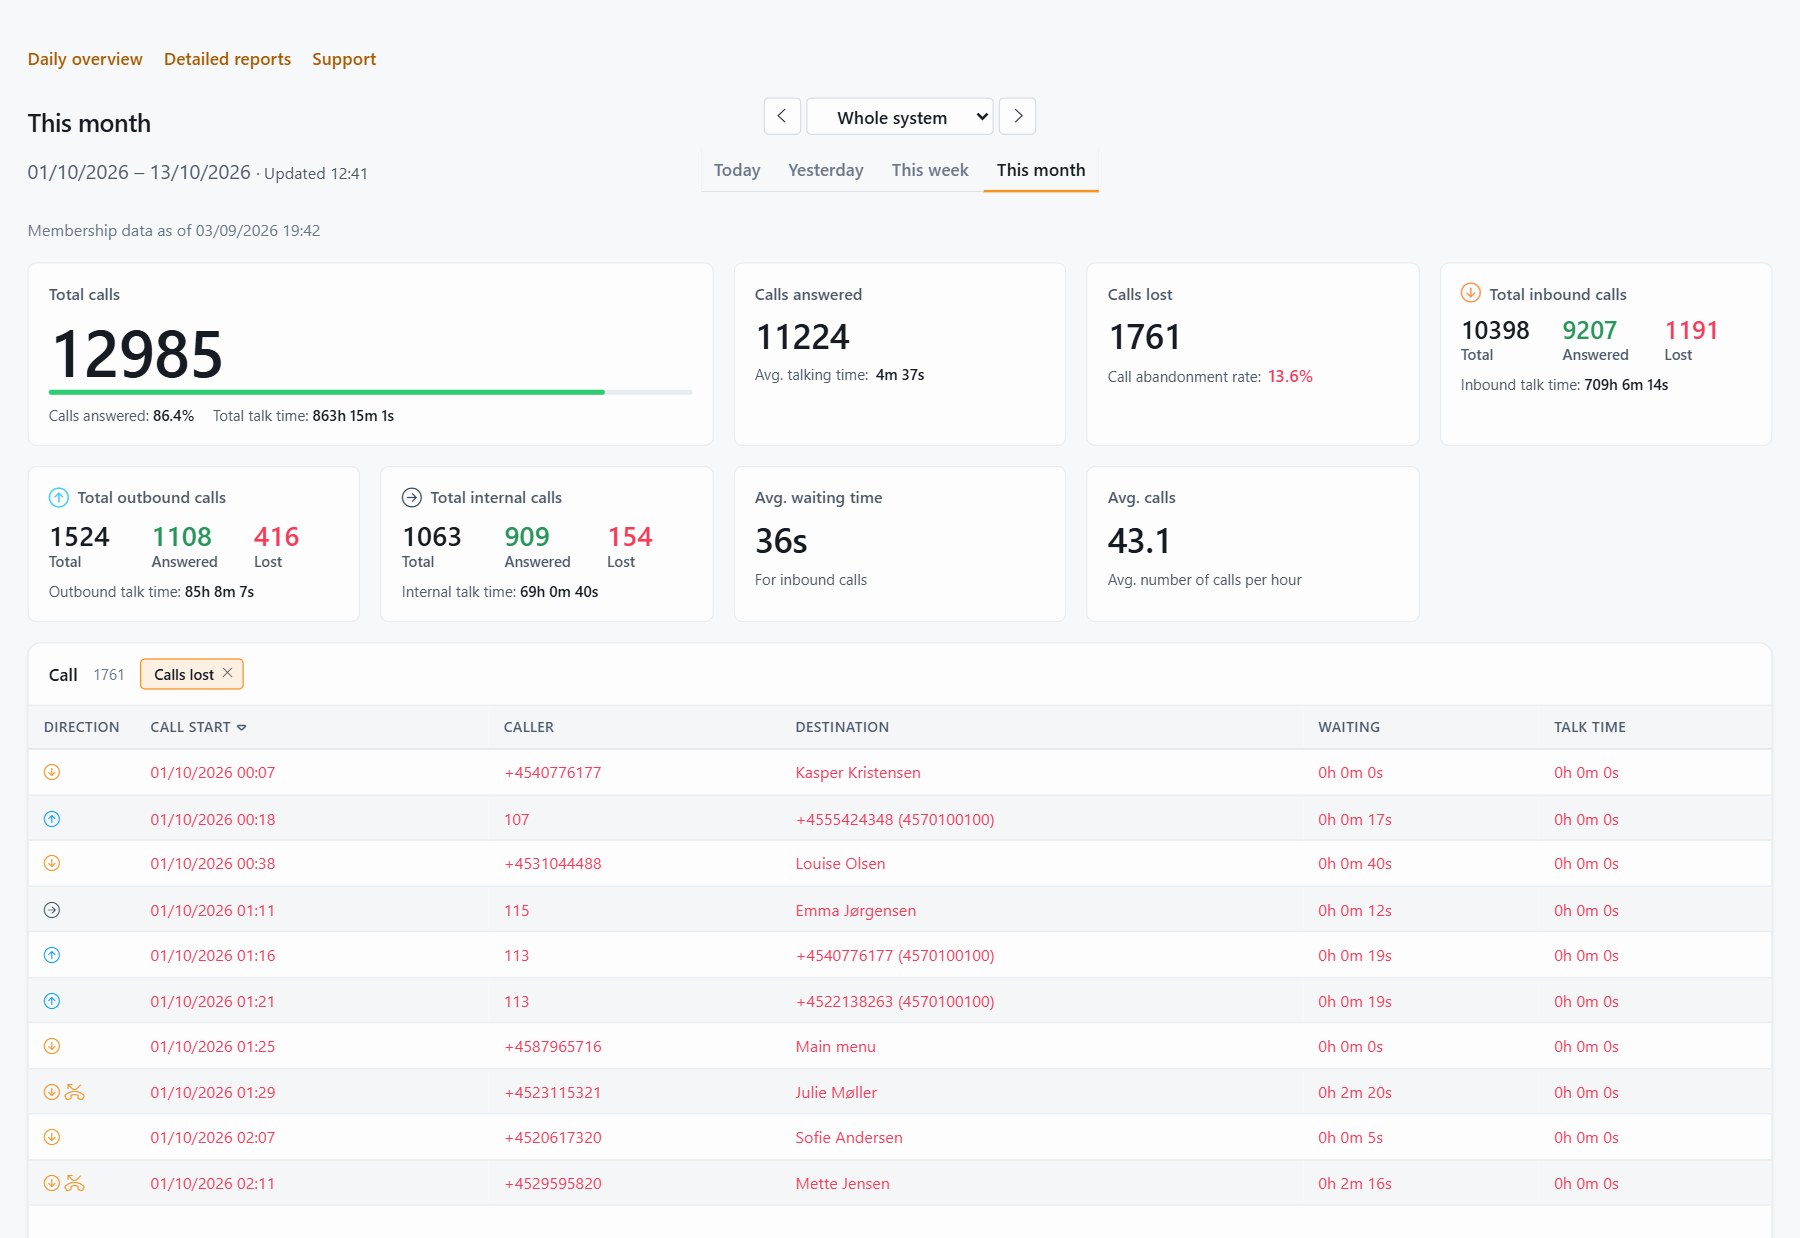
For every userEveryone sees their own day the moment they log in. Department managers see their department, and every number opens the calls behind it.
14 days free · full access · no credit card
The problem
A support agent, a sales manager and the administrator do not need the same page. When they all get the same tenant-wide view, the manager digs, the agent ignores it, and the admin becomes the help desk for both.
Why teams love it
Calls, queues and agents for today, yesterday, this week or this month. View the whole system, a single department or just yourself.
Click a tile and the call log behind it opens, so you go from a total to the actual calls in one click.
Managers see their department, agents see their own day, administrators see everything. Nothing to configure twice.
A collapsible roster shows who is logged into which queue and for how long today.
A goal meter per agent, so the team sees how the day is going without opening a report.
What's inside
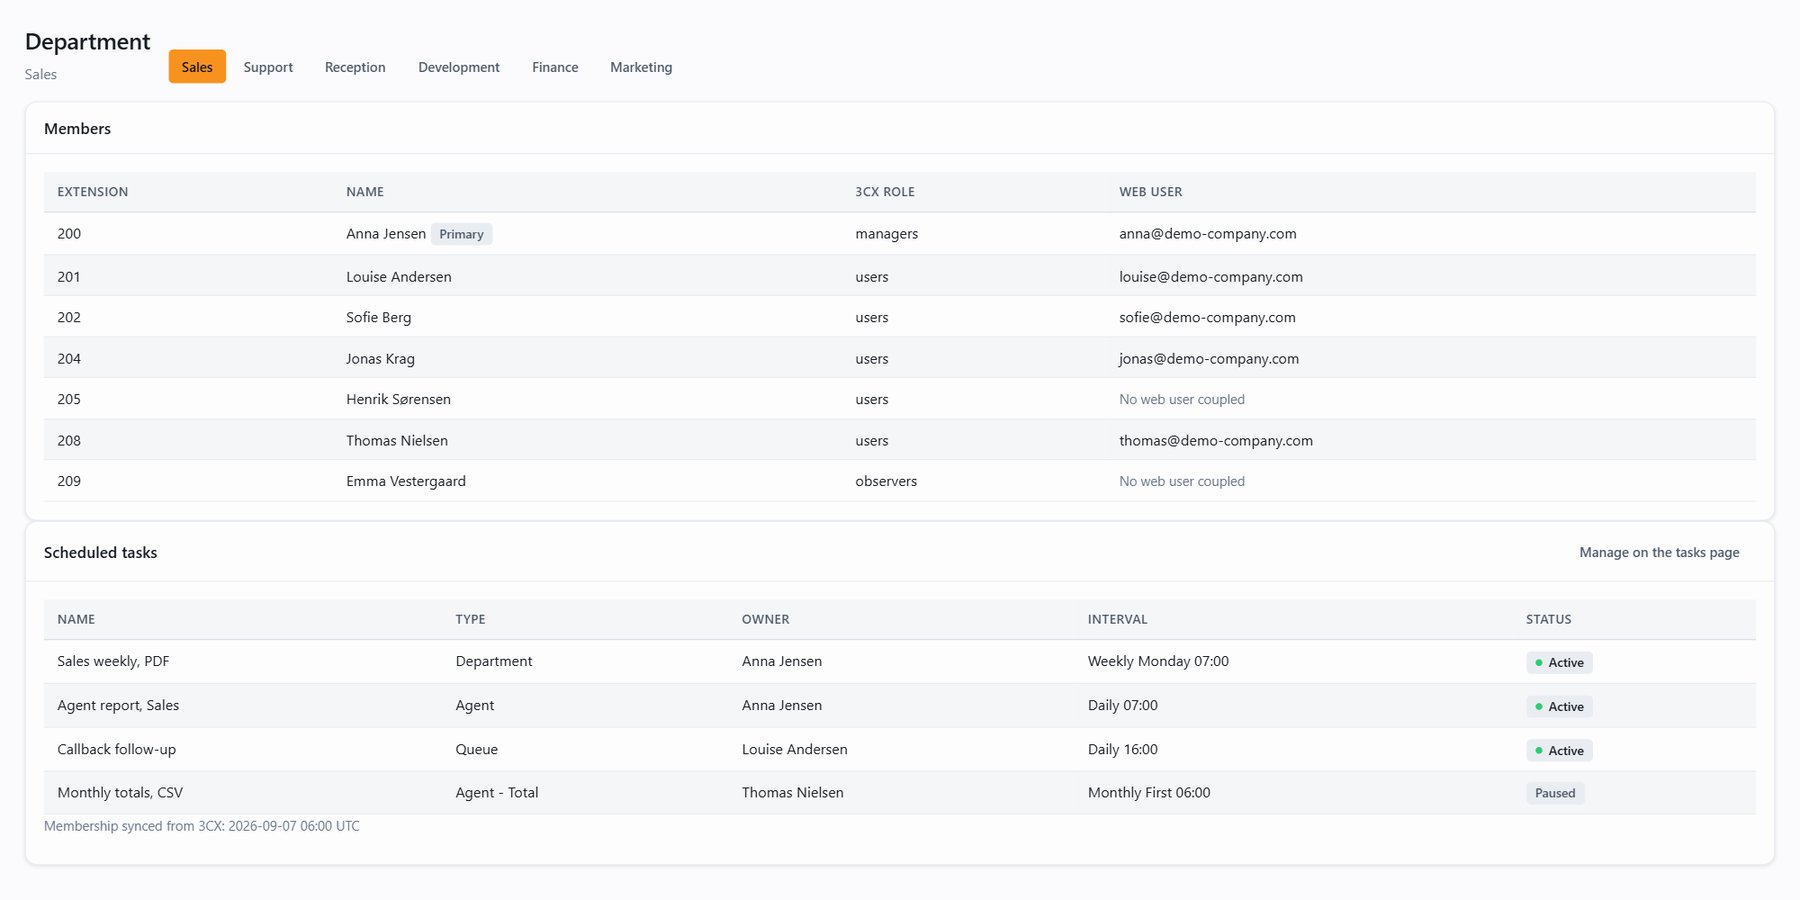
Dashboards and reports follow each user's department, and department managers get their own admin page: the roster of their department and the scheduled reports that belong to it.
Today, yesterday, this week or this month for the person who is logged in.
The department's queues, agents and totals, with the same drill-down.
A department manager manages the scheduled reports of their own department without tenant-wide admin rights.
Couple a web user to an extension once, and the personal dashboard, the department scope and the reports line up.
Administrator and User groups are seeded on the first admin visit. Add your own groups with exactly the features they need.
Choose which queues, IVRs, extensions and ring groups the tenant sees at all.
Departments
Department managers get their own admin page: the roster of their department and the scheduled reports that belong to it, without tenant-wide admin rights.
Department reports
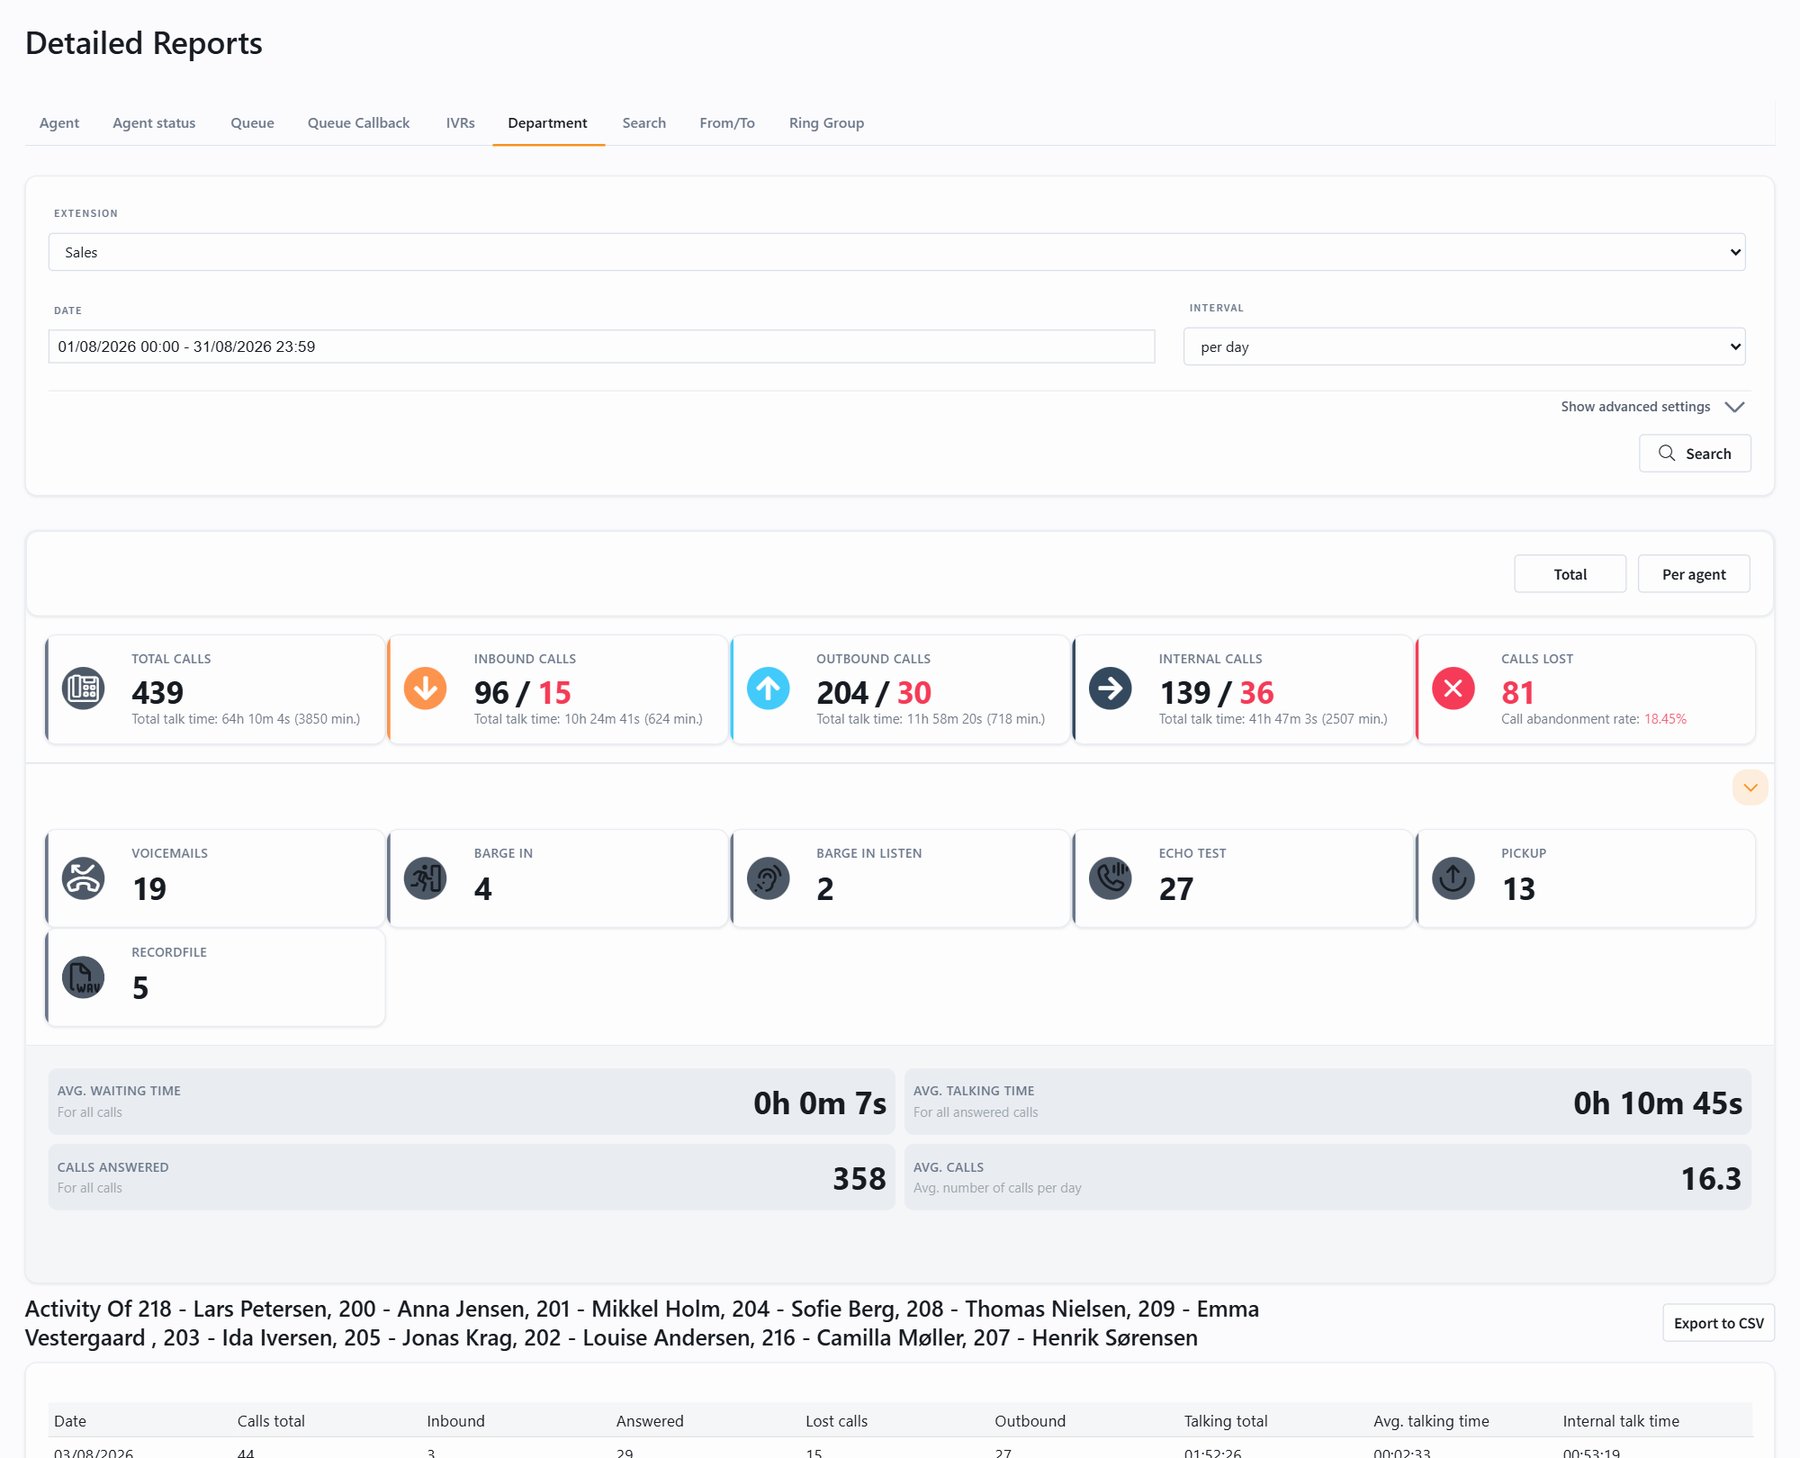
Department managers get the numbers for their own queues and agents, in Advanced search and in the scheduled reports that belong to the department, without tenant-wide rights.
Pricing
For every userEvery web user gets a personal dashboard, and every department its own page. Full access for 14 days, no credit card.
Requires 3CX v20 Update 6 or later, Linux or Windows.
The JEDWare dashboard is the first page after login: calls, queues and agents for today, yesterday, this week or this month, scoped to the person who is looking. Agents see their own day, department managers see their department, administrators see the whole system. Every tile opens the call log behind it.
Your 3CX departments carry straight into JEDWare. Couple a web user to an extension once, and the personal dashboard, the department scope and the reports line up.
Department managers get their own admin page with the roster of their department and the scheduled reports that belong to it, without tenant-wide admin rights. Roles decide features, visibility decides which queues, IVRs, extensions and ring groups a tenant sees at all, and optional two-factor authentication and a 90-day activity log cover the rest.
The dashboard is part of JEDWare, together with reports with the full call flow and live wallboards. See pricing for what is included.
Ready when you are
Free for 14 days with your own 3CX data. Full access, no credit card.
We use cookies and similar technologies to operate and improve our website, analyse website usage, and support functionality and marketing. You can choose which categories you consent to.