
Inbound Call Center Wallboard with QCB
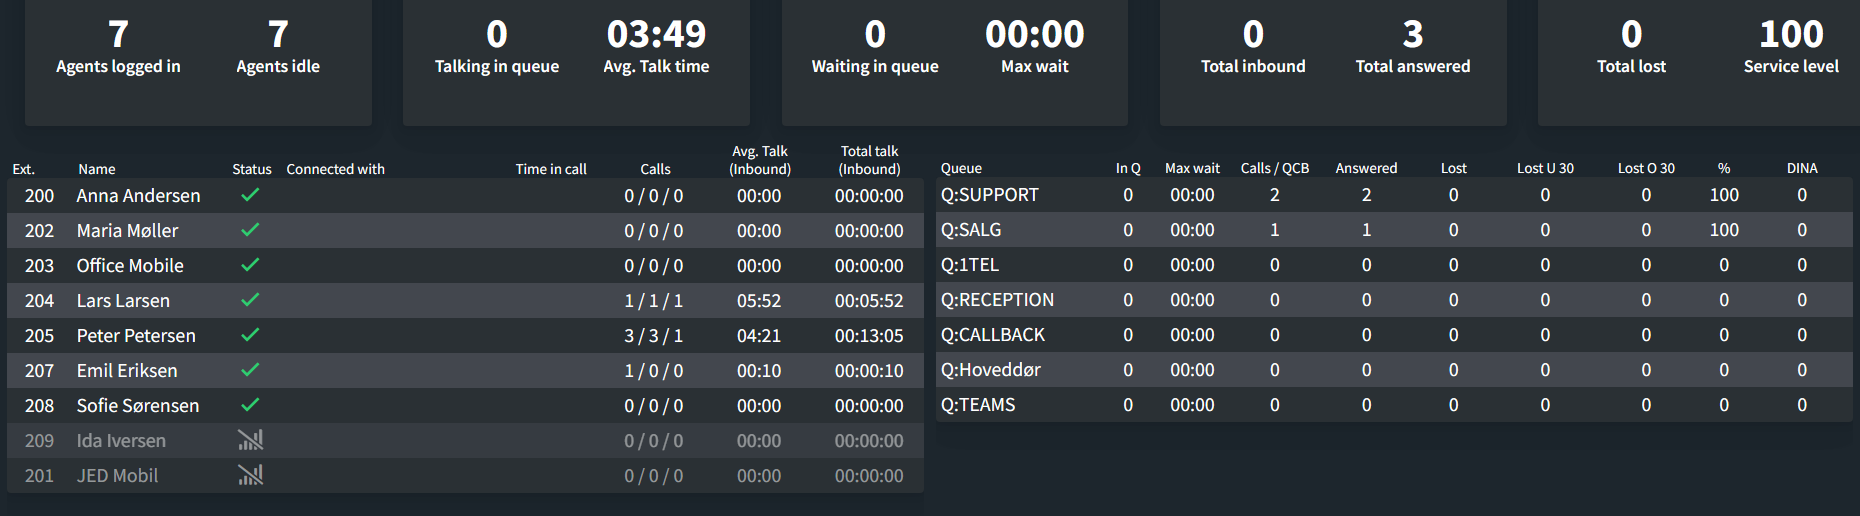
About Wallboard Layout 10
Wallboard Layout 10 shows inbound statistics for both agents and queues, including Queue Callback (QCB) figures; the main difference from Layout 8 being the added Queue Callback.
It is a monitoring tool aimed at inbound call center team leaders and their agents. Agents and queues are sorted automatically according to the measure you choose, so the board reorders itself as the day develops.
The wallboard can show up to 25 queues alongside the individual call statistics of their agents. Both the agent list and the queue list scroll independently, so the layout adapts to the number of queues you have added.
The header bar
A small identifier – e.g. “Wallboard 5120: Layout 10” – is shown in the top-left corner. Quote this to support if you need help with this specific board.
Centered, you will see your own custom Wallboard Name.
Top statistics
The row of tiles across the top summarizes every queue shown on the wallboard combined.
Agents logged in | Number of agents currently registered across all extensions |
Agents idle | Number of agents with the Available status |
Talking in queue | Number of agents currently on a queue call |
Avg. Talk time | Average talk time across all answered queue calls |
Waiting in queue | Number of callers currently waiting across all queues |
Max wait | Longest wait time currently recorded |
*Total inbound | Aggregate of all calls into the queues shown on the wallboard |
Total answered | Number of answered queue calls |
Total lost | Number of lost queue calls |
Service level | Combined service level for all queues |
*Total inbound counts every queue on the board together. For example, if queue 800 has 20 calls, queue 801 has 100 and queue 802 has 50, the tile shows 170.
The service level is calculated as:
Answered / (Calls − Lost U 30) × 100
Note: The 30-second threshold is configurable. See Lost call under / over separation below.
Agent columns
Ext. | The agent’s extension number |
Name | The agent’s name |
Status | The agent’s current status: available, busy, dialing, ringing, DND, or one of two custom statuses |
Connected with | The number the agent is connected to, prefixed with the queue it came through, for example [Queue 1]: 50505050 |
Duration | Live timer showing how long the agent has been in the current status or call |
Calls | Three figures: inbound | outbound | internal. Hover the value to see the breakdown labeled |
Avg. Talk (Inbound) | The agent’s average talk time. Only answered inbound calls count |
Total talk (Inbound) | Total time the agent has spent on inbound calls |
Offline agents are shown greyed out at the bottom of the list unless you choose to hide them.
Queue columns
Queue | Queue name |
In Q | Callers currently waiting in this queue |
Max wait | Longest current wait time in this queue |
Calls / QCB | Total calls, and how many of those were callbacks |
Answered / QCB | Answered calls, and how many of those were callbacks |
Lost / QCB | Lost calls, and how many of those were callbacks |
Lost U 30 | Calls lost after waiting less than the configured threshold |
Lost O 30 | Calls lost after waiting more than the configured threshold |
% | Service level for this queue |
DINA | Calls routed onward from the queue to another destination |
The three Lost columns are shaded in increasing intensity so the eye is drawn to the queues that need attention.
About QCB
Queue Callback lets a caller hang up and keep their place in the queue, receiving a call back when an agent becomes free. Where a column reads 12 / 4, the first number is the total and the second is the callback portion of that total, so 12 calls, of which 4 were callbacks.
Wallboard Settings
Selecting and ordering queues
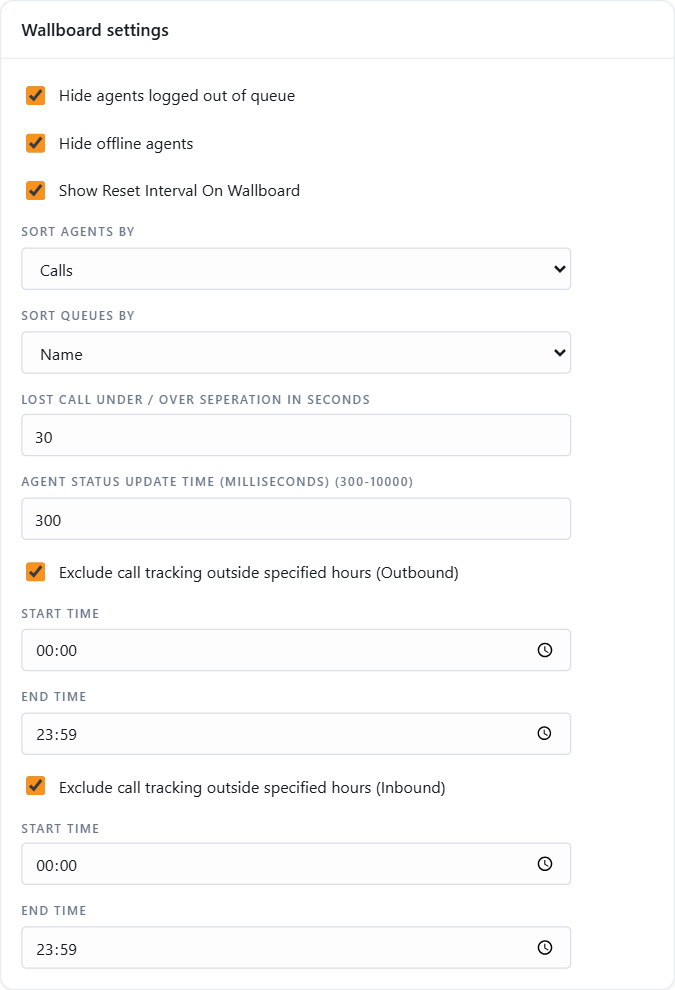
Queues are managed on the Queues tab of the wallboard settings (screenshot below). Use the search box to find a queue by name, then:
- Add queue: opens a list of the 3CX queues that are not on the board yet. Tick the ones to add.
- Drag the handle or use the up and down arrows: sets the order the queues appear in.
- Name: the name shown on the board. Rename a queue here without touching 3CX.
- Delete (the minus icon): removes the queue from the wallboard after a confirmation.
Reordering and renaming are saved with the Save bar that appears at the bottom of the page. The new order and names show on the board after its next reset.
Hiding Agents
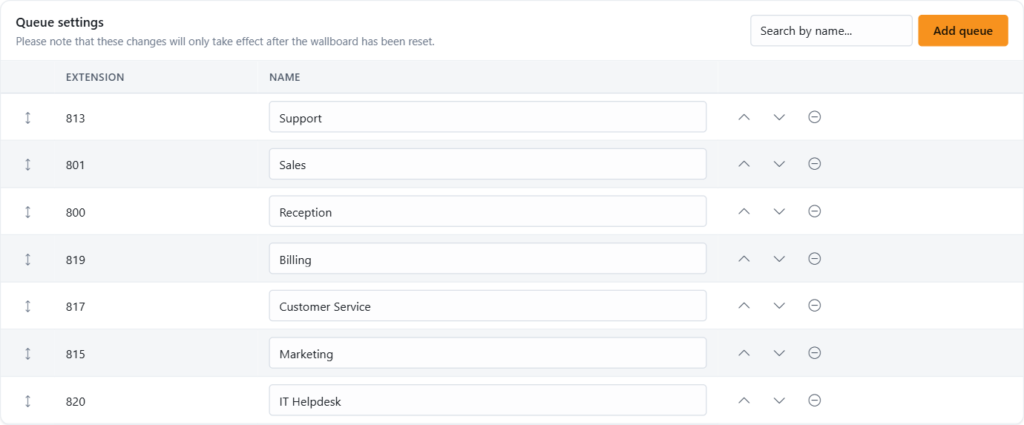
Three options control which agents appear:
- Hide agents logged out of queue: removes agents who are not currently signed into any queue on the board.
- Hide offline agents: removes agents whose extension is not registered. Left unticked, they appear greyed out at the bottom of the list.
- Agents Hidden On Wallboard: a per-extension list on the General tab of the wallboard settings. Tick individual extensions to exclude them permanently, or use Select all. This is the right place for extensions that are not agents at all, such as reception phones or system extensions.
Sort Agents By
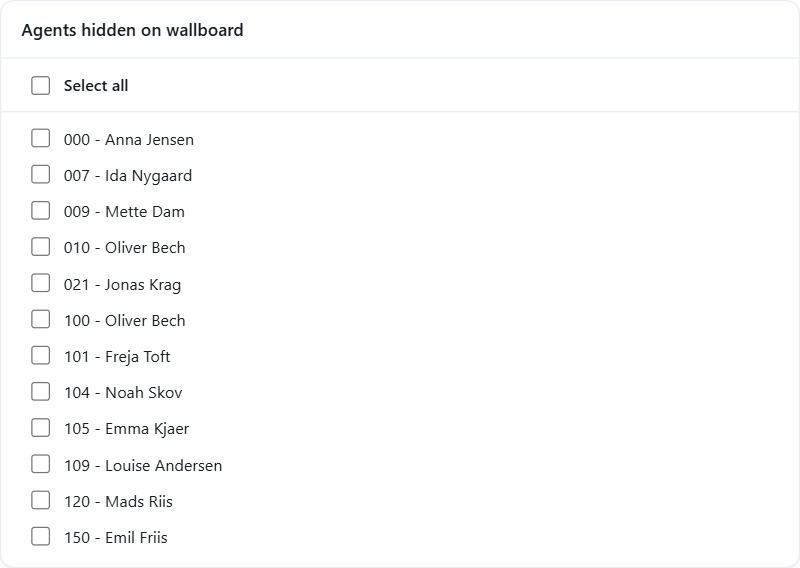
Choose the default order of the agent table:
- Extension
- Name
- Calls
Sort Queues By
Choose the default order of the queue table:
- Name
- People waiting in Queue
- Longest wait time currently
- Total calls
- Answered calls
- Calls lost
- Calls lost that waited less than 30 seconds
- Calls lost that waited more than 30 seconds
- Answered Calls %
- DINA
Lost call under / over separation
Service levels matter in an inbound call center, and the Lost U 30 / Lost O 30 split is what feeds the calculation. The default threshold is 30 seconds; enter any value in seconds that suits your targets.
Service level is calculated as:
Answered / (Calls − Lost calls under xx sec.) × 100
Exclude call tracking outside specified hours
Two independent options, one for Outbound and one for Inbound, restrict counting to your opening hours, so calls outside those hours do not distort the day’s figures.
Agent status update time
Agent status updates are sent every 300 ms by default. On larger installations with many queues, many agents per queue, or a 3CX server with limited resources, this can be too frequent. Values from 300 to 10000 ms are accepted; 5000 ms is a good first step if the board feels sluggish.
Wallboard reset time
Set when the wallboard’s counters reset. Choose the interval (for example Daily) and the time of day on the General tab. Tick Show Reset Interval On Wallboard to display the current reset window on the board itself, so nobody has to guess which period the figures cover.
Reset wallboard
Reset wallboard now clears the wallboard’s statistics immediately, without waiting for the scheduled reset.
Click Save in the bar at the bottom after every change. Settings are not applied until saved.
Not using JEDWare yet? See what a JEDWare 3CX wallboard can put on the wall, then start a free 14-day trial.