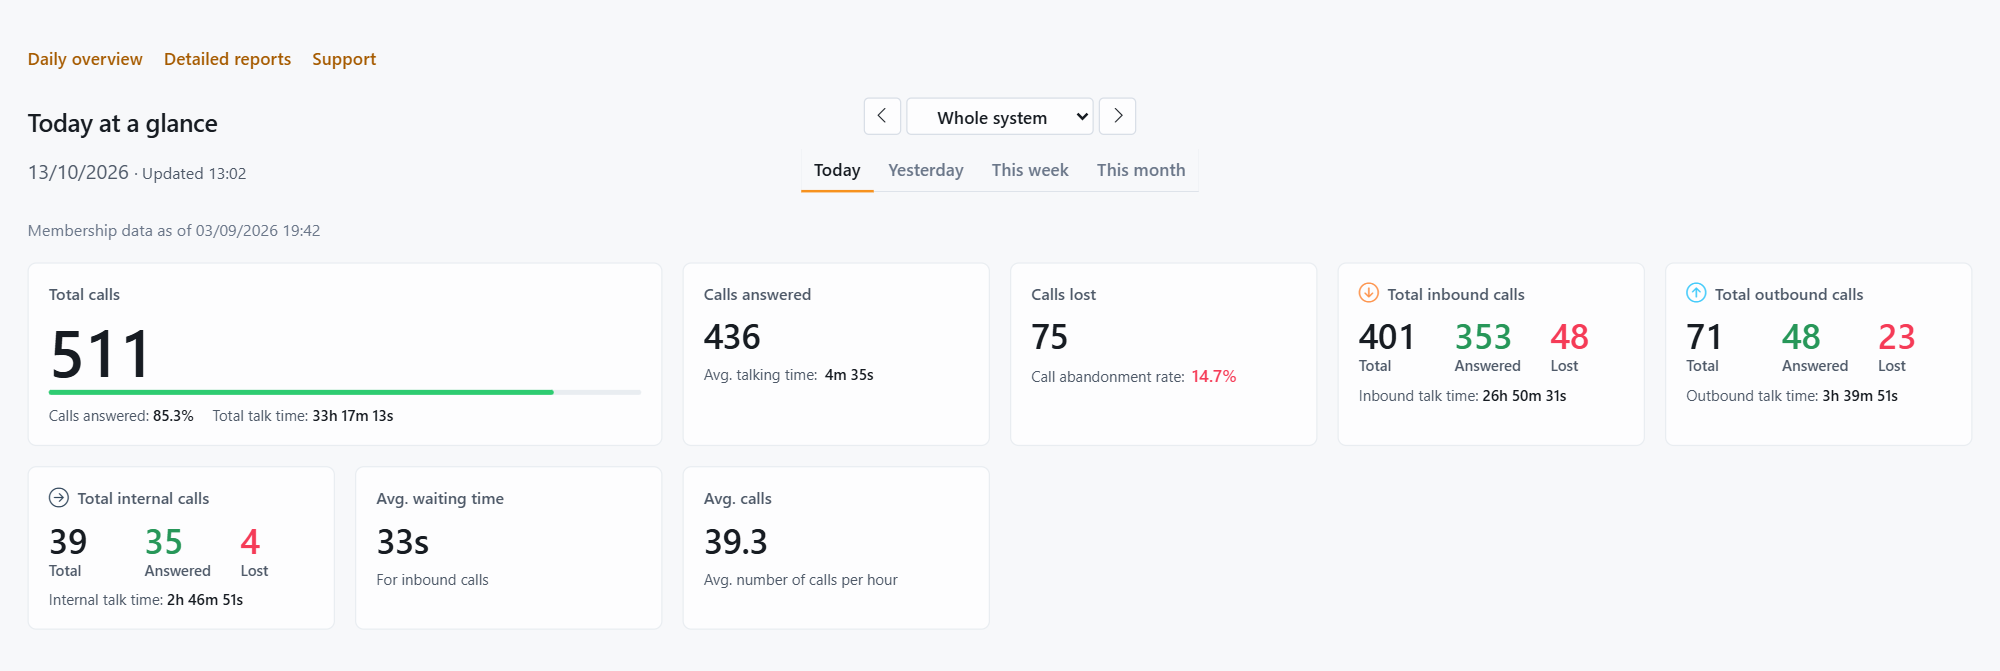
The Dashboard is the first thing you see when you log in to JEDWare. It gives you a live overview of call activity. Depending on your role, that means your own calls, your department’s calls, or the whole phone system.
What the tiles show
The Dashboard summarizes the selected period in a set of tiles: total calls, answered calls, lost calls, inbound, outbound and internal calls, along with average waiting time and average calls per hour. Every tile is clickable. Click one to open the list of calls behind that number.
Choosing a period
Use the tabs to switch between Today, Yesterday, This week and This month. All times follow your personal timezone setting.
Switching what you look at
Next to the period tabs you may see a selector with arrows. It switches the Dashboard between the views your role gives you access to:
- Your stats: your own extension’s calls. This is the default view when your login is connected to an extension.
- A department: the combined calls of one department you have access to. Department members with the right permission also see a per-agent breakdown.
- Whole system: every call in the phone system. Shown to users who may see everything but have no personal extension.
If you don’t see the selector, your role currently gives you exactly one view, which is expected.
Department views require JEDWare integration 26.9.1 or newer (September 2026). On older integrations the Dashboard shows company-wide numbers, and JEDWare will recommend an update.